Lesson
Introduction to Canvas Analytics
Canvas offers a built-in suite of analytics tools to help you optimize your customer engagement strategy after launch.
Multivariate Testing
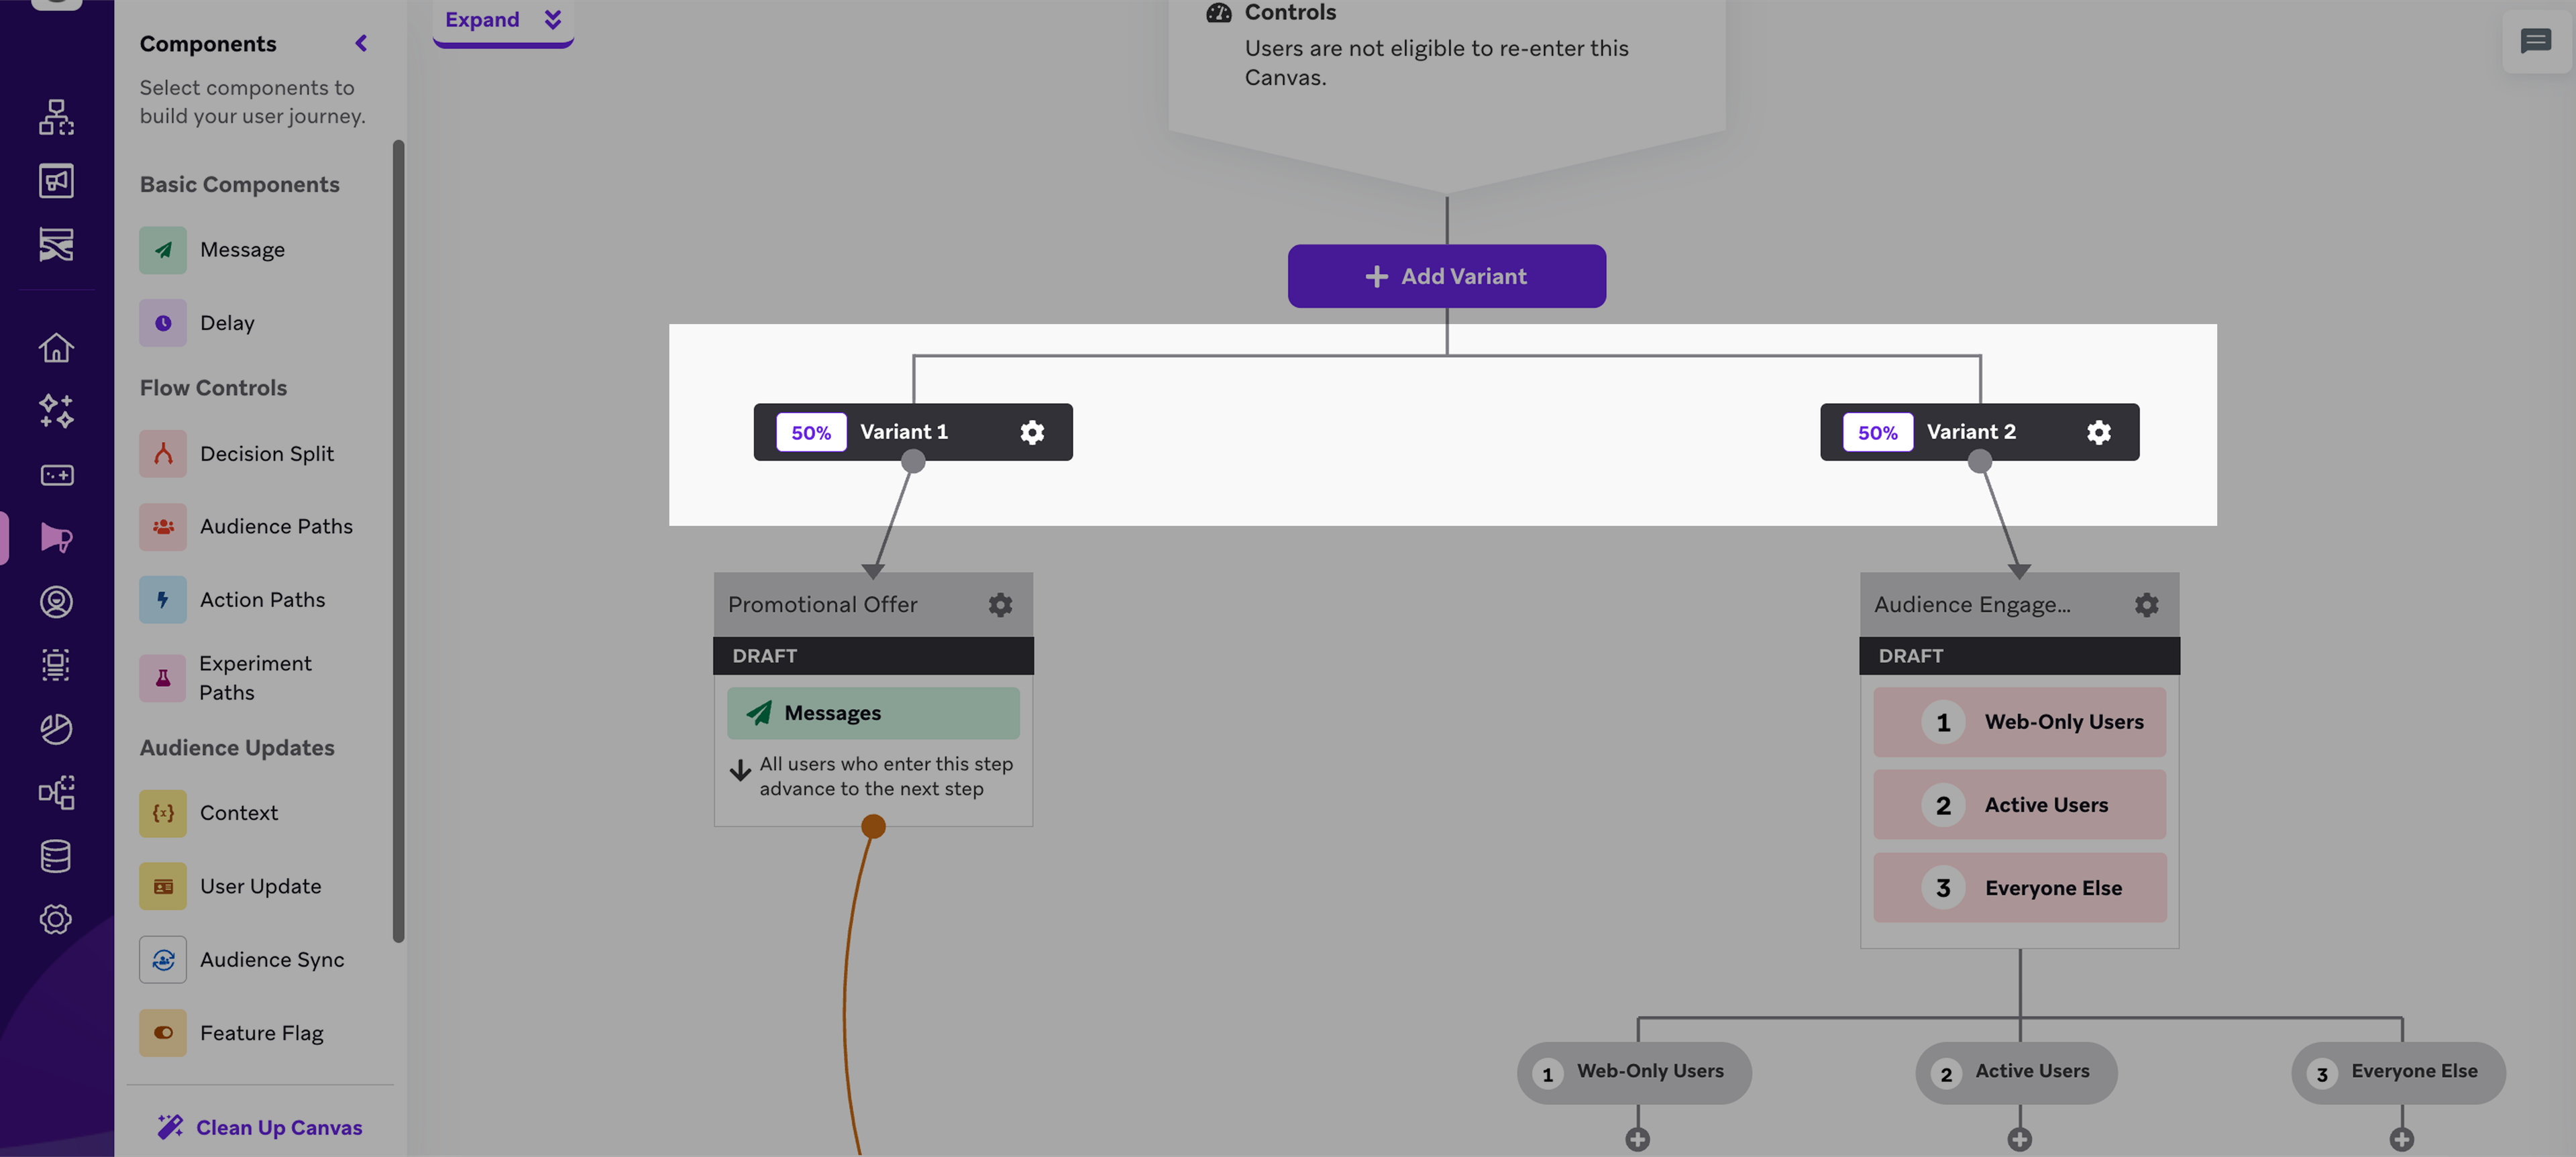
You can perform multivariate testing for the entire Canvas by adding a variant at the top of your Canvas. Multivariate testing lets you distribute users down entirely different Canvas journeys and test which strategy is most effective for your conversion goal.
Canvas Details Page
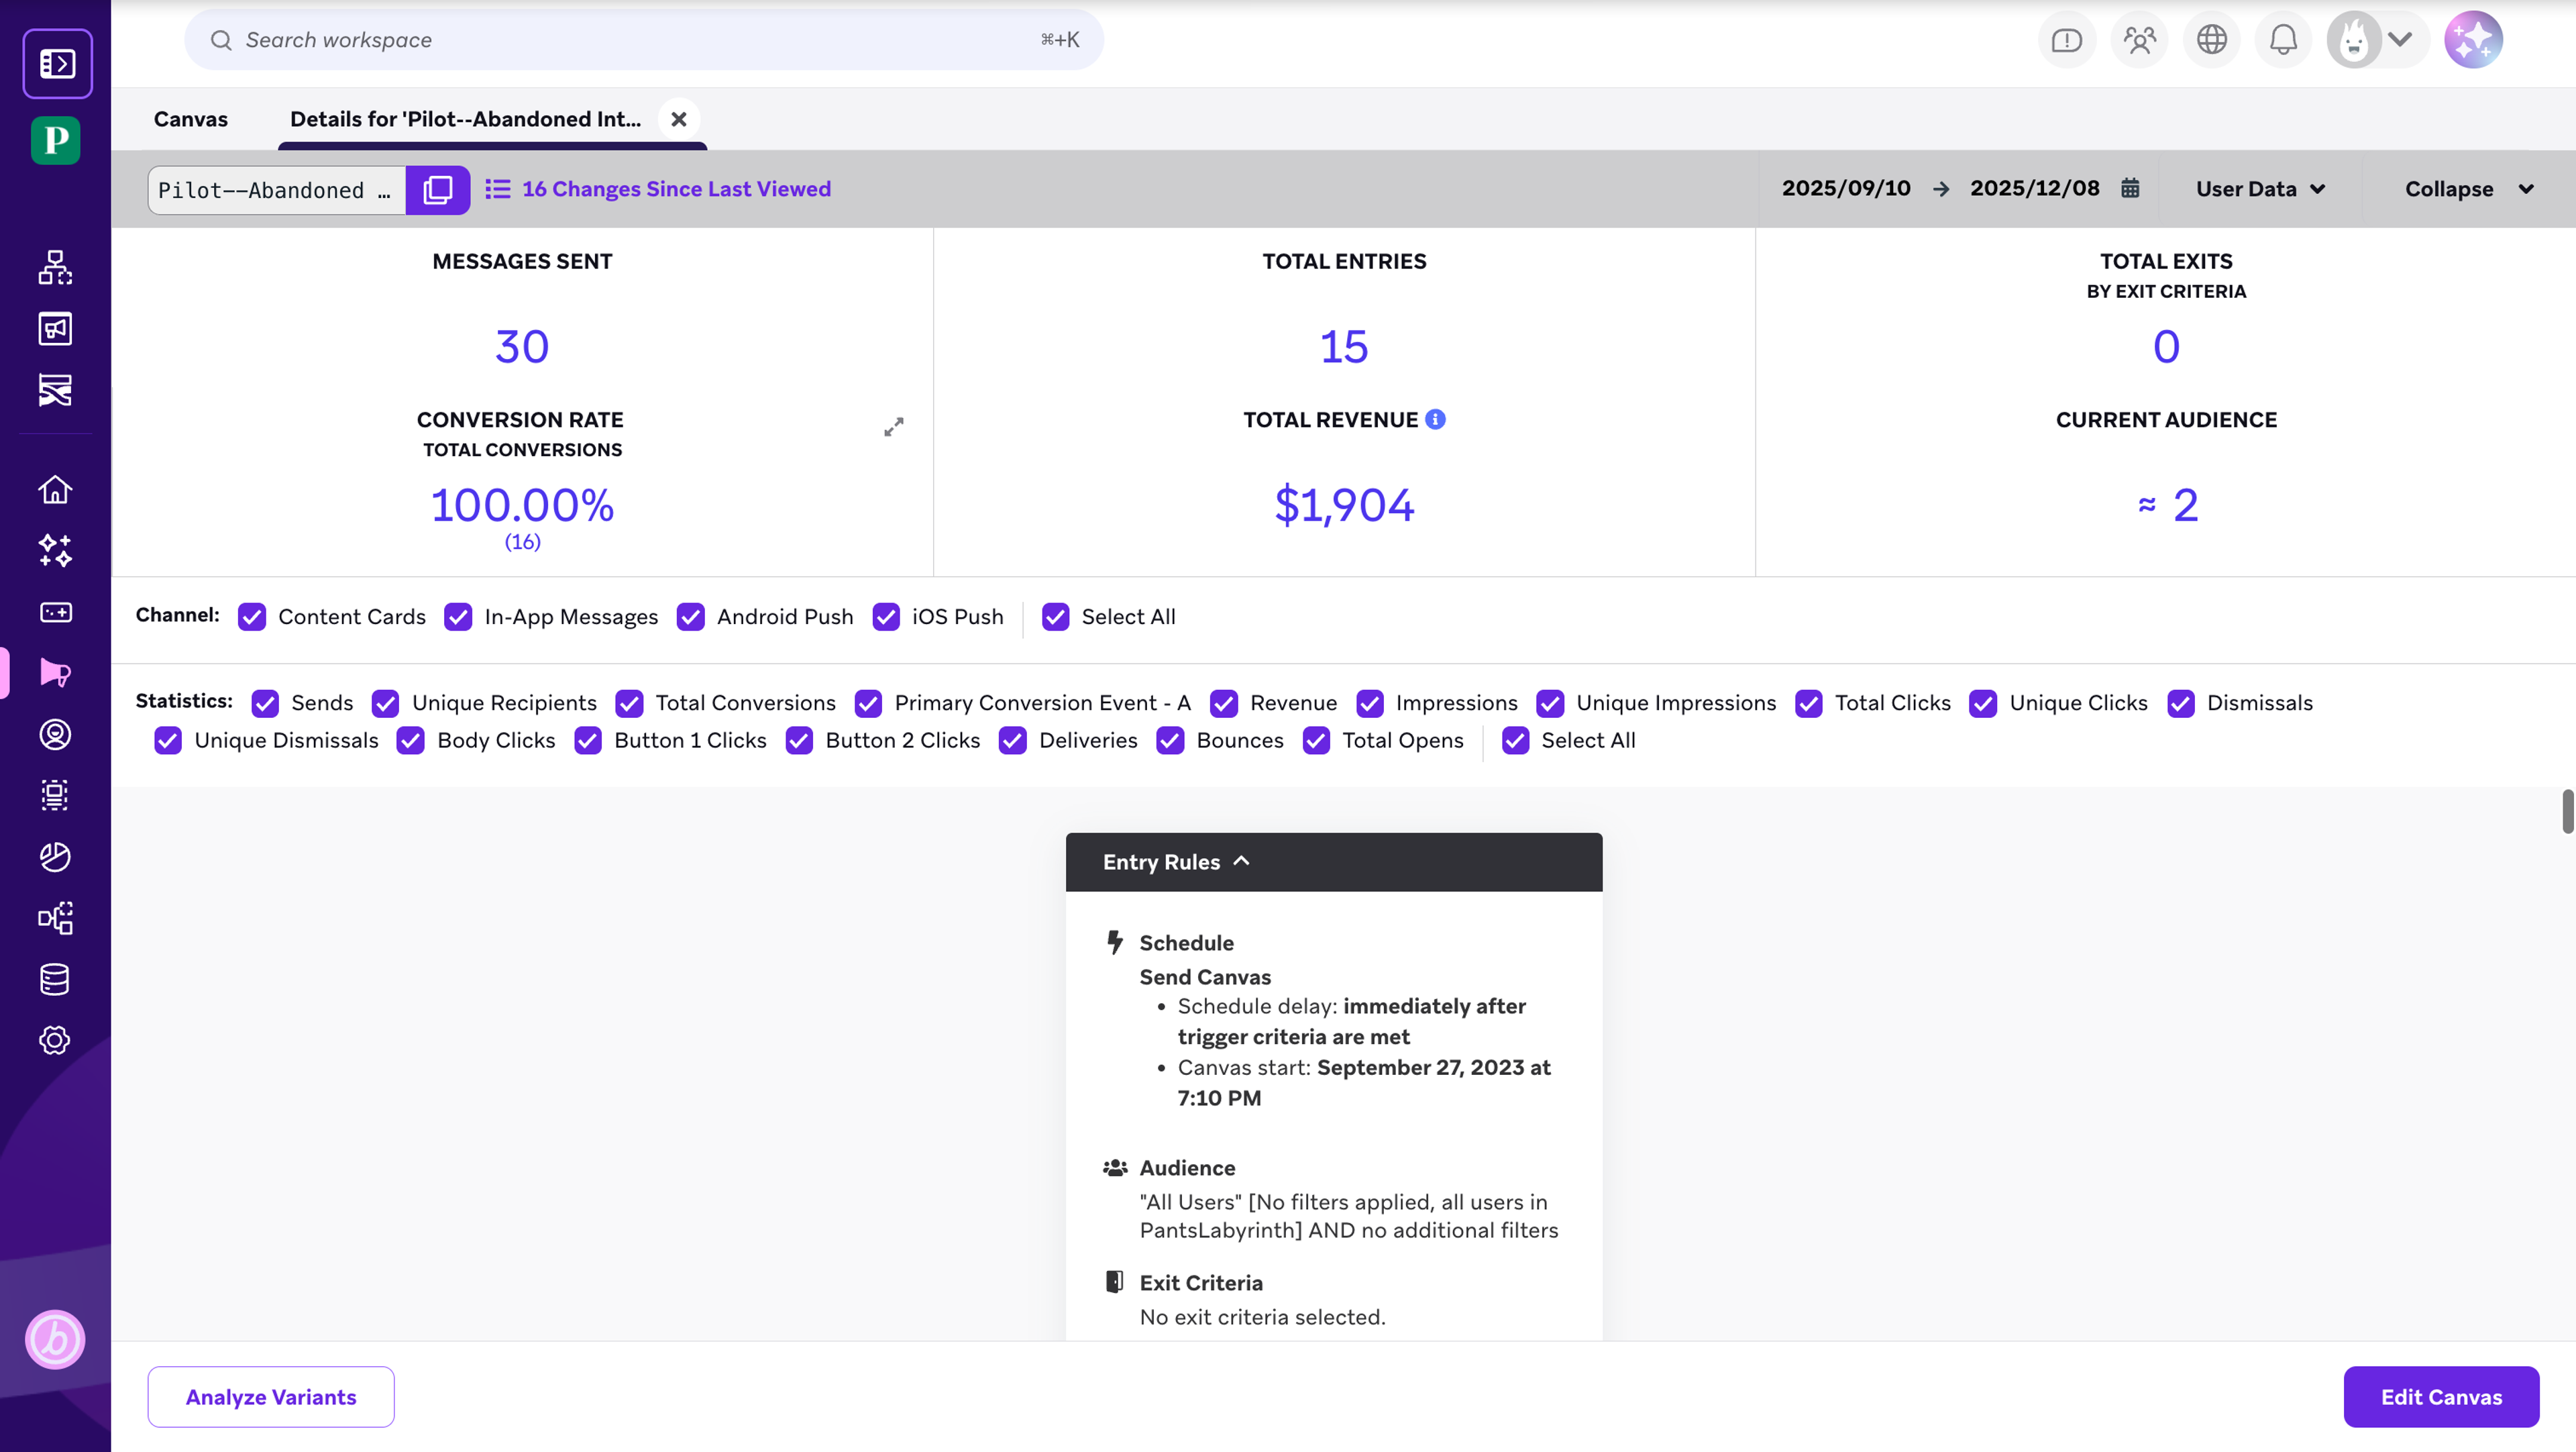
Once you launch your Canvas, data about your Canvas' performance begins populating your dashboard. Open your Canvas, and the first thing you’ll see is an overview of your top-line statistics.
Component-Level Data
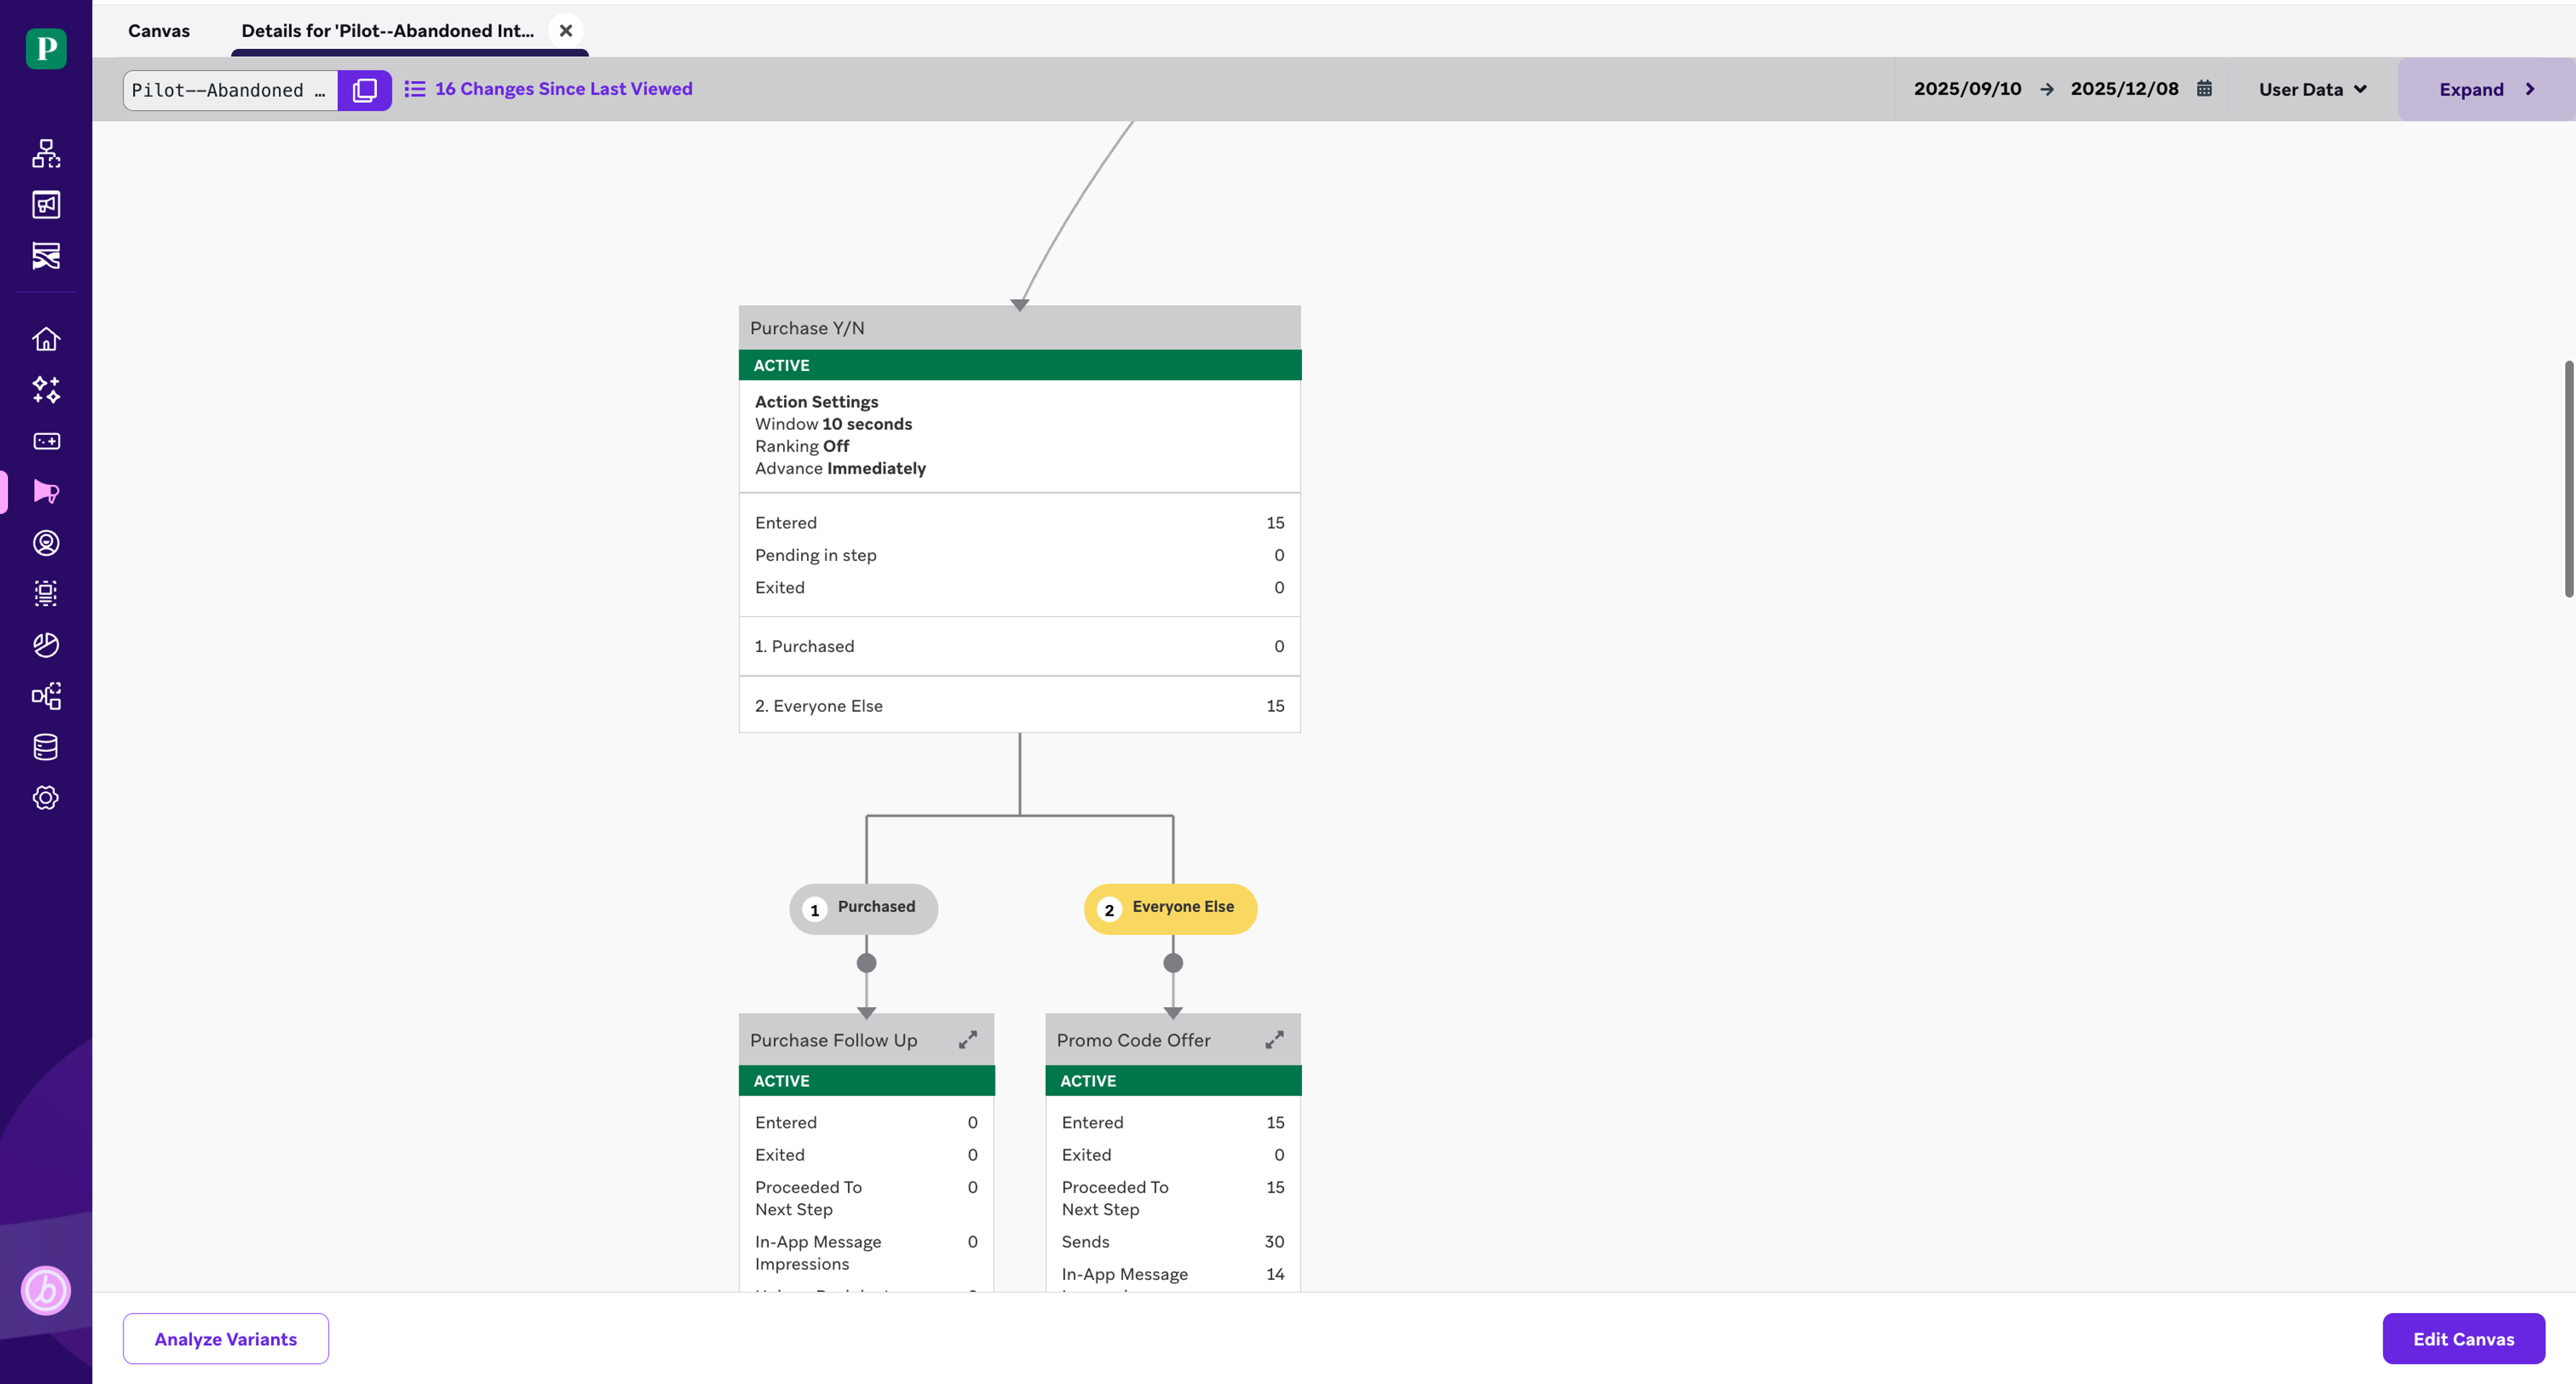
You can also track the performance for each variant and component in your build. Click on a component to see more granular data.
Analyze Variants
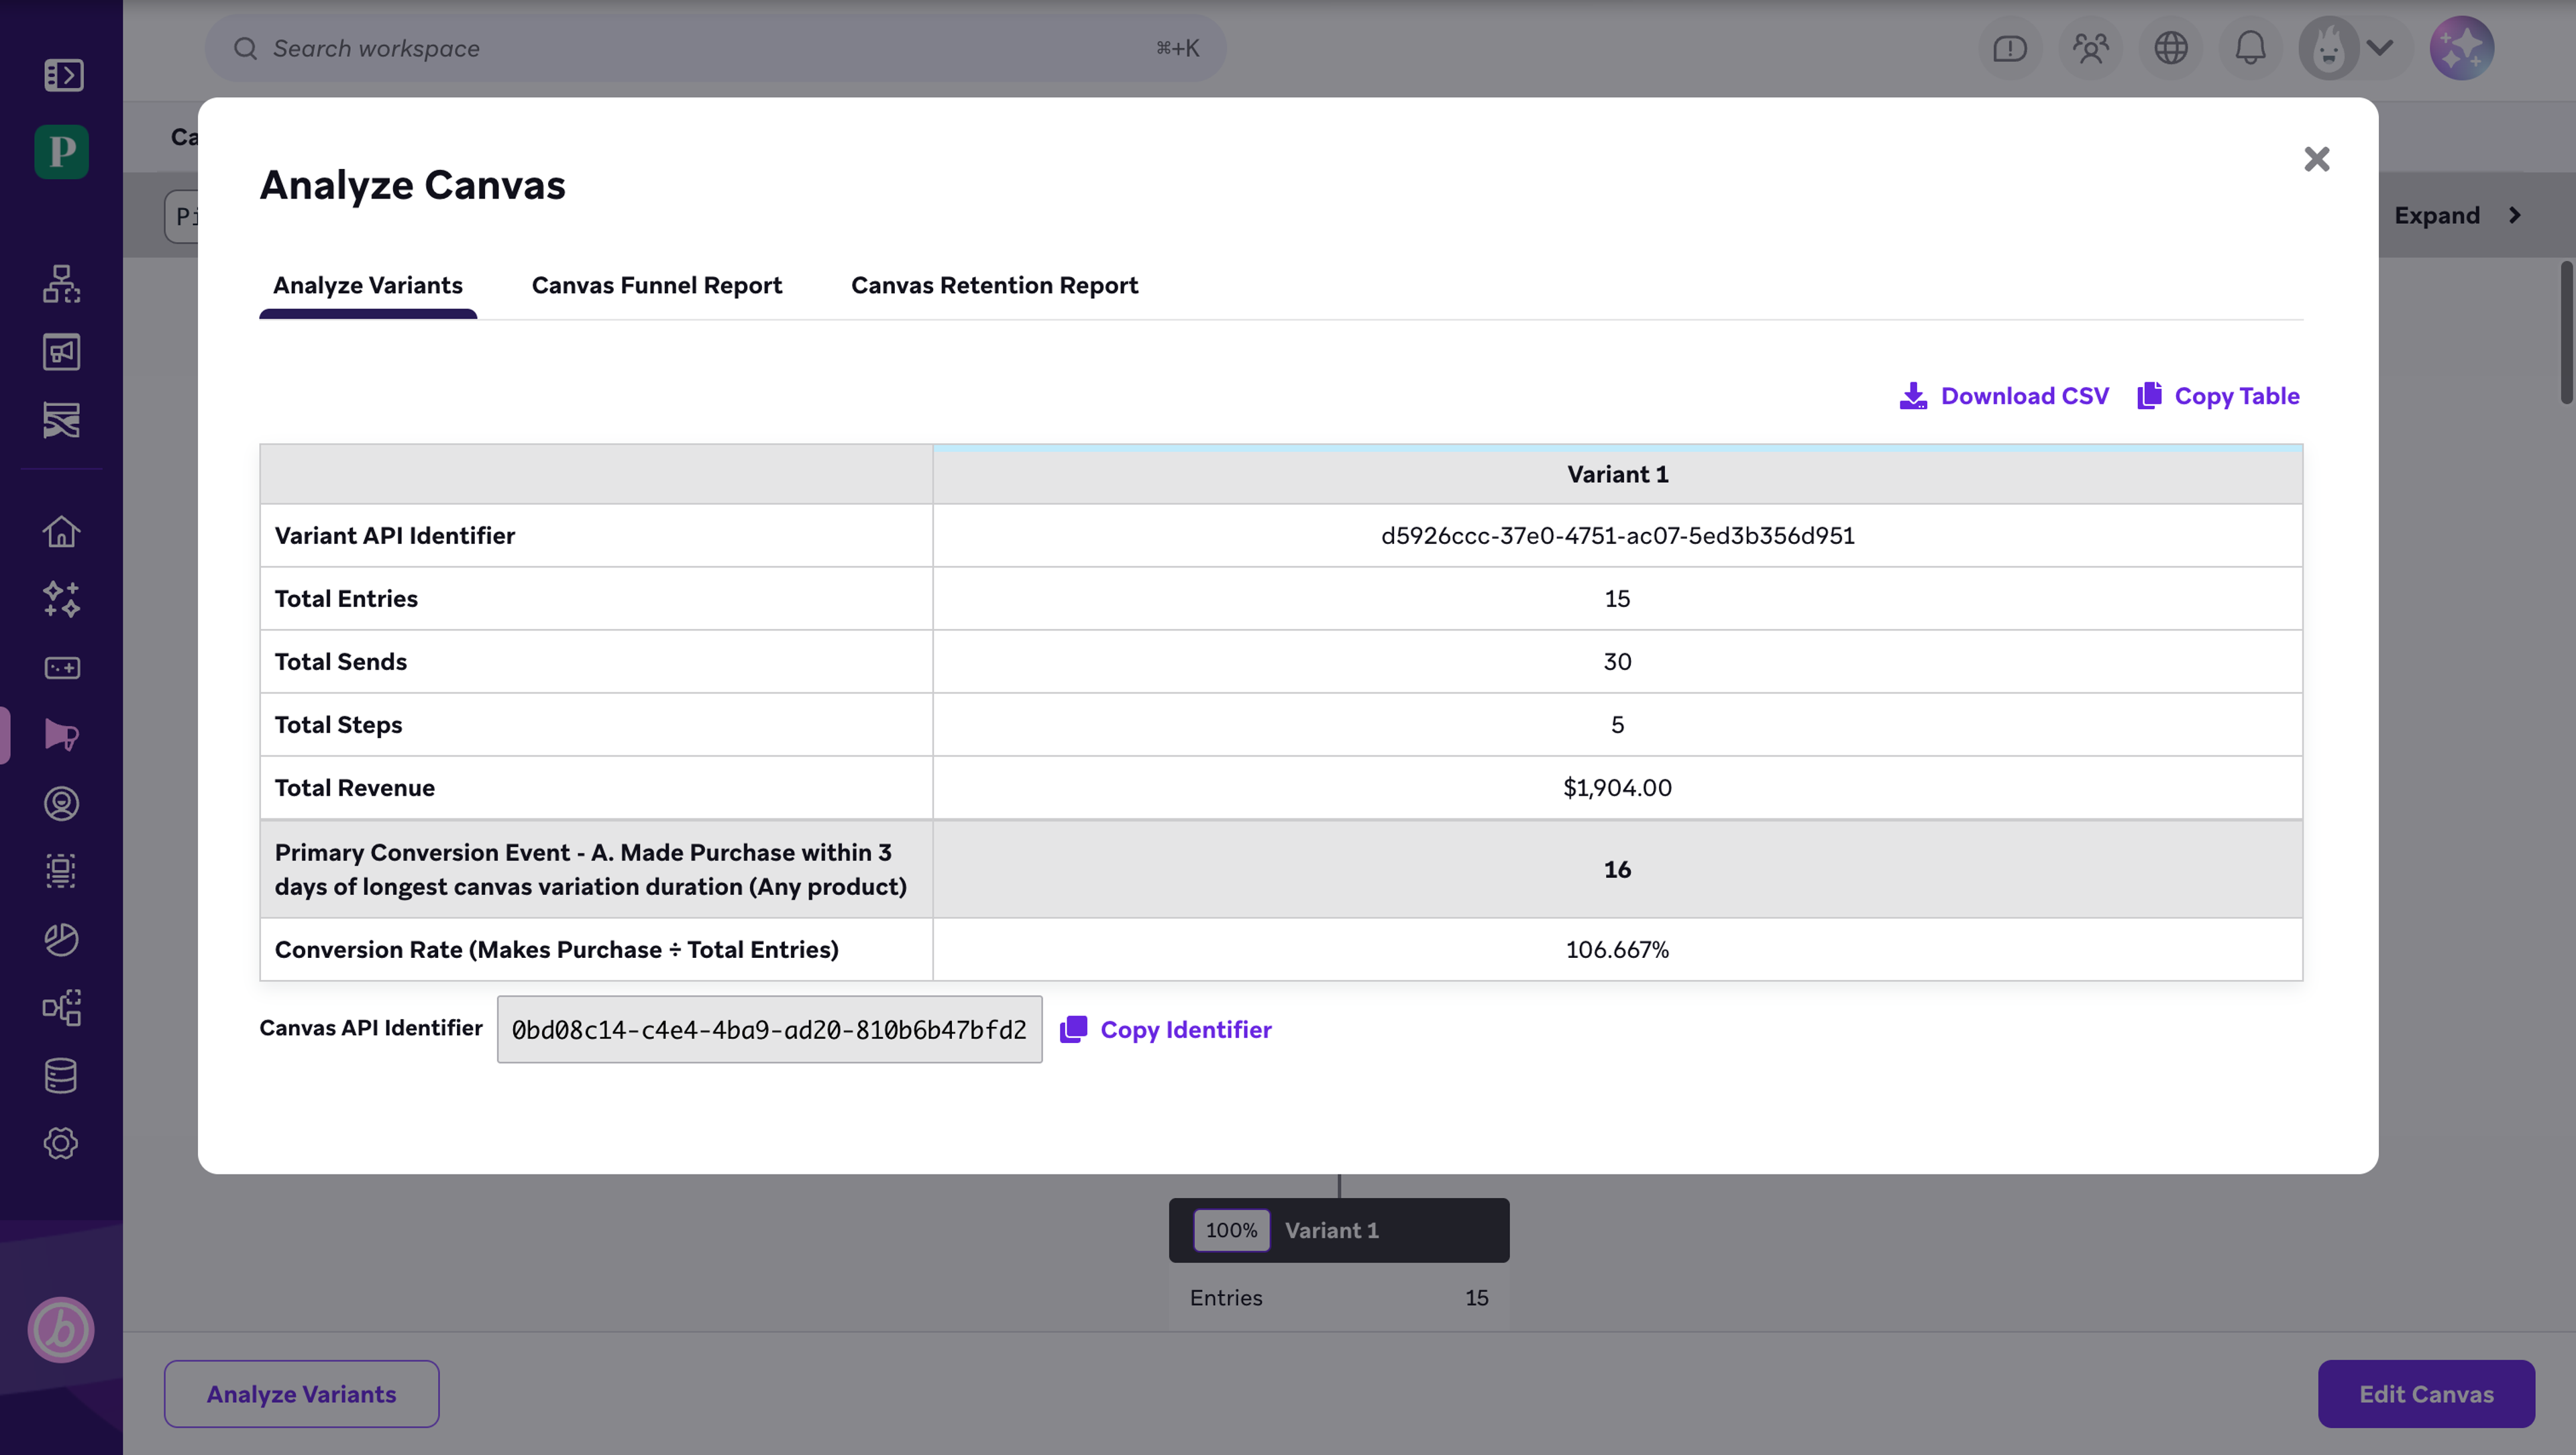
At the bottom of the Canvas Details page, click Analyze Variants for more reporting functions. You’ll find results for variant-level testing, options to run funnel reports, and options to run retention reports.
The “Analyze Variants” tab presents a table for multivariate testing analysis, just like in experiment paths.
Next Steps
There’s so much more to learn about the suite of analytics tools that Canvas offers. Be sure to register for the Data-Driven Messaging Strategy learning path. There, we dive further into multivariate testing, Canvas analytics, and Canvas reporting features, teaching you how to best leverage these tools to optimize your Canvas for your particular goals. We also teach you to strategize your Canvas builds around our powerful Intelligence Suite, the foundations for best-in-class interactions with your customers.